🚀 Register for Amazon DSP Unlock advanced audience targeting & scalable growth!
Register now

Report Builder
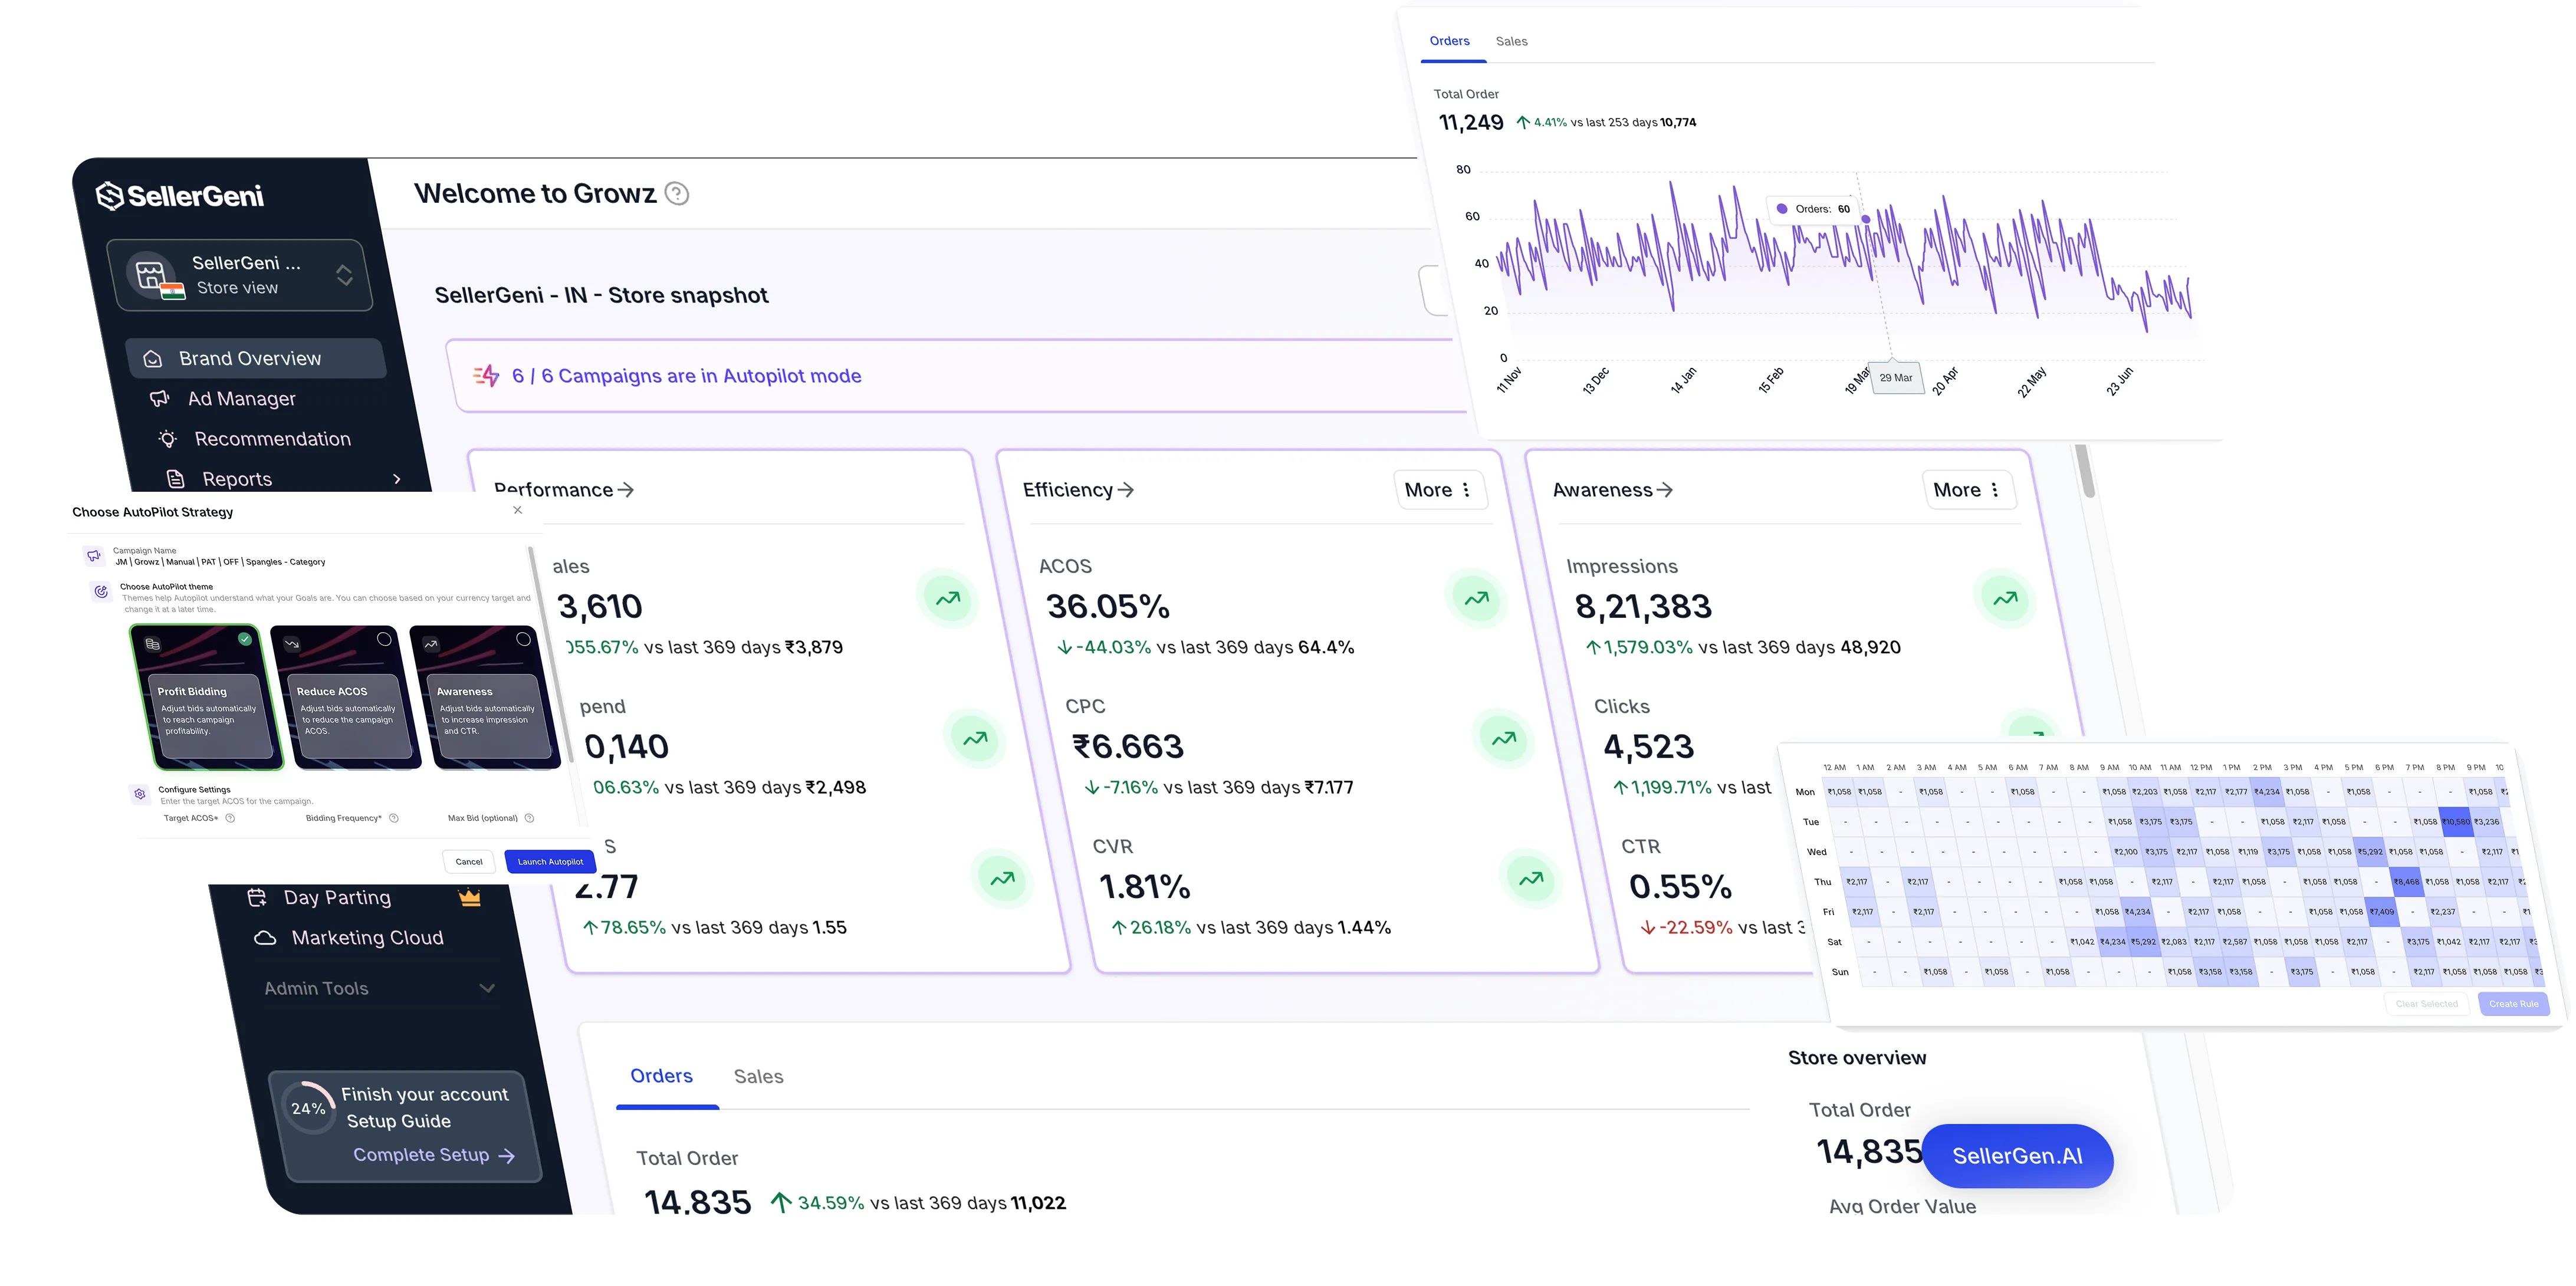
Type what you want to know, like “compare ad spend vs sales”, and Report Builder draws it. Keep the charts you need on your own dashboard.
Amazon Ads Advanced Partner · Breakthrough Partner Award winner, India, 2026
Your dashboard3 charts
Ask
No filters to learn and no export to clean up. Ask a question the way you would ask an analyst.
Ask anythingSuggestions
Dashboard
Every answer can be added to your own dashboard, so the numbers you check each morning are in one place.
Your Dashboard3 charts
Templates
If you would rather not start from a blank page, open a ready-made dashboard and adjust it.
Explore Templates3 templates
Why SellerGeni
Ask the way you would ask an analyst.
Answers drawn for you.
Keep what you check every day.
Ready-made dashboards to start from.
Beside your campaigns, reports and automation.
Early betas and direct support from Amazon.
Getting started
Type what you want to know.
YouReport Builder draws the answer.
SellerGeniAdd it to your dashboard.
OngoingWorks with
A reporting tool in SellerGeni that answers questions about your ads and sales in plain language and turns the answers into charts.
Things like sales over time, ad spend against sales, impressions and clicks trends, top products by revenue and ACoS trends for campaigns.
Yes. Add any chart to your dashboard, or start from a template such as Ad Performance Overview, ASIN Performance or Keyword Overview.
No. You ask in plain language.
AI-powered decisions. Real-time optimizations. Advanced reporting. Agentic AI. Results you can trust.